
"Low kick point." "Mid launch." Three words on a website, describing a property that actually has about thirty numbers in it. Bend profile is the last and finest thing a shaft fitting adjusts, and it is also the thing the marketing flattens hardest. This chapter is about the measurement underneath the adjective.
EI, and what the machine actually does
The measurement is called an EI profile. E is the modulus of elasticity of the material, I is the area moment of inertia of the cross-section — together they describe how stiff the tube is at one specific point along its length.
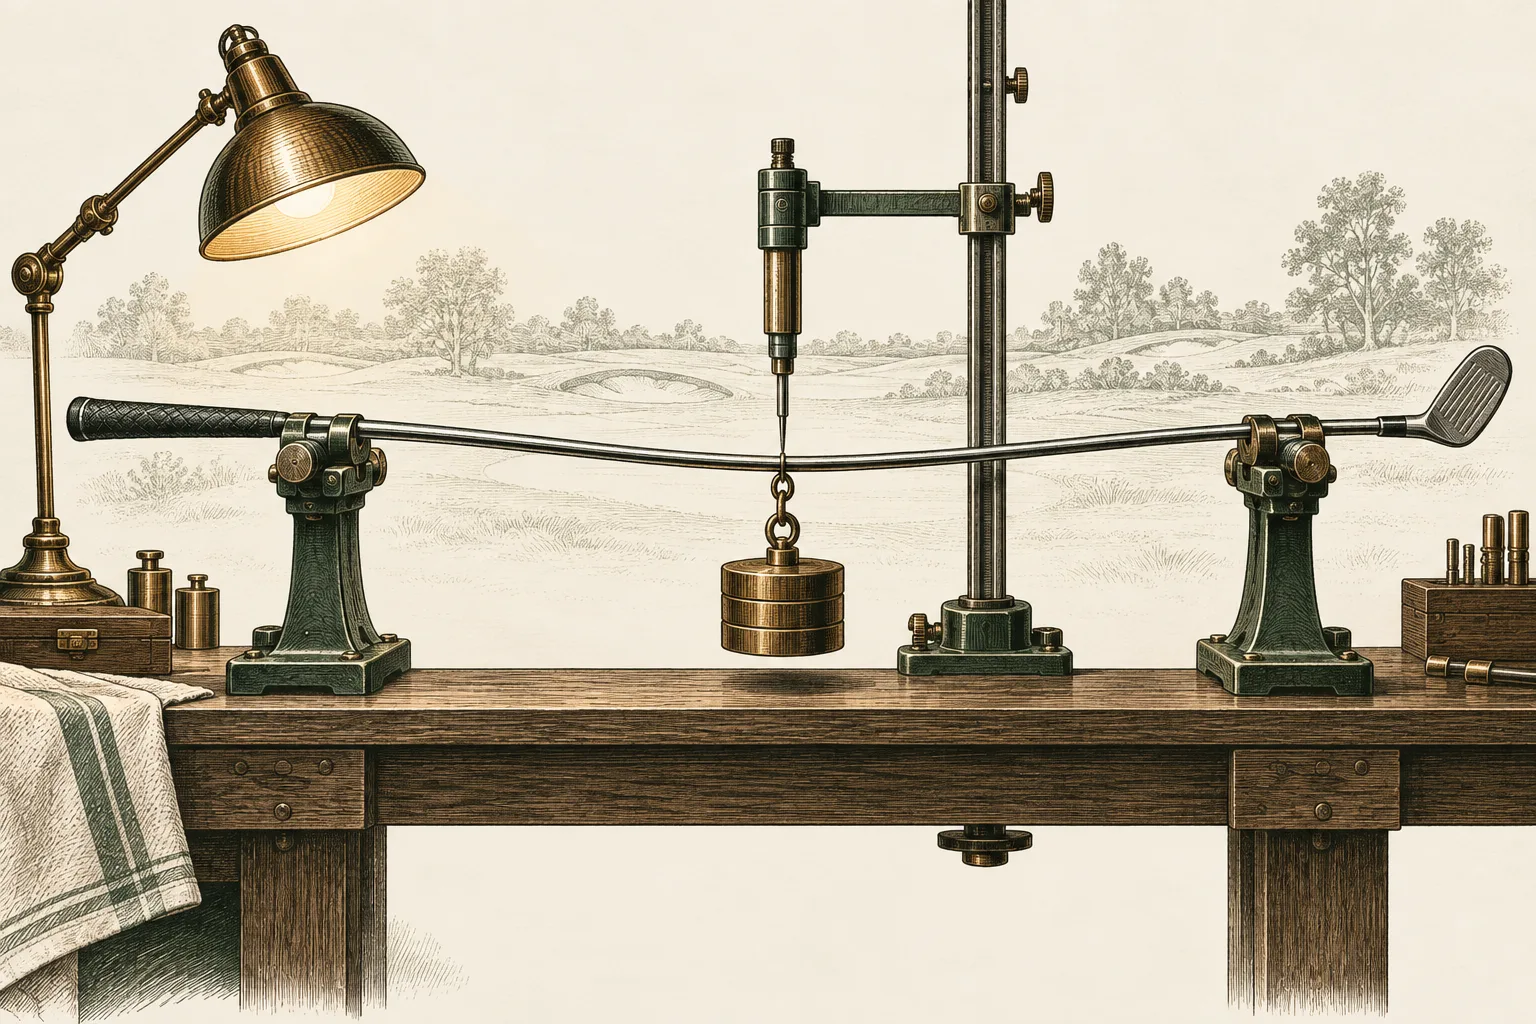
Getting it is refreshingly mechanical. Support the shaft at two points, hang a known weight in the centre, and measure how far it deflects. Convert the deflection into EI using the load, the span and the deflection. Then slide the supports along and do it again. Russ Ryden's instrument — the one several shaft companies use — takes a reading every inch, from six inches off the tip to six inches off the butt. That is roughly thirty numbers for a driver shaft.
"Kick point" is one of those thirty numbers, or rather a hand-wave at the region where a few of them change fastest. Ryden's own verdict on the vocabulary is blunt: high, mid and low kick point "are just that" — labels — and only three-point EI profiling reveals the actual bend character of a shaft.
The signature: the useful version of the chart
Raw EI curves are hard to compare, because a heavier or stiffer shaft sits higher on the chart everywhere and swamps the shape you were trying to see.
So Ryden plots the first derivative instead: not how stiff the shaft is at each point, but how fast the stiffness is changing from point to point down the shaft. He calls it the bend profile signature, and it strips out weight and flex so two shafts can be compared on shape alone. A neat demonstration from his own database: a set of 2013 Mitsubishi Diamana B shafts in several weights and flexes had genuinely different stiffness levels and essentially the same bend profile. One design, scaled. That is what a family is.
Some makers do publish profiles, in their own dialect
Graphite Design rates its shafts on a butt-mid-tip scale, and the numbers are more informative than any paragraph of copy. The Tour AD EK is rated 4-3-4 from butt to tip — stiff, firm, stiff. The long-serving Tour AD DI is 2-2-4. Same maker, same scale: the DI is dramatically softer in the butt and middle with a similar firm tip, the EK is stiff at both ends with a softer middle.
You do not need a lab to read that. You need the maker to publish it, and some do.
Does the shaft actually "kick"? Two studies say: yes, and it doesn't matter as much as you think
This is the part the industry is quietest about, and the peer-reviewed answer is genuinely surprising.
Betzler and colleagues, in Sports Biomechanics in 2012, gave twenty golfers two clubs differing only in bending stiffness. The less stiff club produced faster recovery from lag to lead bending before impact and increased grip angular velocity — the shaft really was kicking. The payoff: 0.45% more clubhead speed and 0.7% more ball speed. Their own conclusion was that the changes lacked meaningful practical significance for the shaft type investigated.
MacKenzie and Boucher, in the Journal of Sports Sciences in 2017, put thirty-three golfers of varying skill through two driver shafts of differing stiffness and found the mechanism behind that wash. The flexible shaft did produce a greater shaft-deflection contribution to clubhead speed — and it also produced reduced grip angular velocity at impact. The two effects cancelled, leaving comparable overall clubhead speed. About half the individuals showed a significant difference between shafts.
What did change was delivery. The flexible shaft created larger bend loft and bend lie angles — that is, more dynamic loft and more toe droop. The stiffer shaft showed greater bend close angles. Notably, the changes in grip orientation did not produce significant differences in face orientation at impact.
So what is a bend profile actually for?
Not speed. Speed is what everyone hopes for and the research keeps declining to hand over.
Profile is a delivery tool. It moves dynamic loft, it moves how far the head droops toward the ground, and through those it moves launch and spin by a modest, real amount. The practical shorthand a fitter uses is the tip section: a stiffer tip gives lower launch and lower spin, a softer tip gives higher launch and more spin. That is the lever, and it is worth a degree or two of launch and a few hundred rpm — not a new golf swing.
The part almost nobody tells you: profile is a build decision
Here is the fact that reframes the whole topic. The same shaft, same part number, can be a high-launch shaft or a low-launch shaft depending on how the builder cuts it.
KZG's head builder Matthew Mora published measured frequency charts for KBS shafts, taken on a Mitchell Golf frequency meter with a 2.5-inch clamp at specified head weights. Take the KBS Tour in regular, around 118 grams, and look at the 7-iron across KBS's own trim options:
- 4.0 trim — 3.25 inches off the tip — 284 cpm. Chart note: High Trajectory.
- 4.5 trim — 4.25 inches — 291 cpm. Mid Trajectory.
- 5.0 trim — 5.25 inches — 294 cpm. Low Trajectory.
- 5.5 trim — 6.25 inches — 297 cpm. Low Trajectory.
One shaft. Three trajectories. Thirteen cycles per minute of spread at the 7-iron, which is more than a whole flex step by the builders' usual arithmetic. The reason is simple: the tip is the softest part of the shaft, so every inch you cut off the tip removes soft material and stiffens the profile where it matters most.
Which means "what bend profile do you play?" is only half a question. The other half is "and how was it trimmed?" — and if nobody wrote that down when your irons were built, nobody knows.
What to do with all this
Compare profiles, not adjectives. If two shafts are both "mid launch," go find their curves or their published butt-mid-tip numbers.
Ask for the trim spec. Any builder worth using will record how much came off the tip of each iron. It belongs with your build sheet.
Do not buy a profile to fix a swing. Every honest number in this article is small. Weight and flex do the heavy lifting; profile is the fine adjustment on top of them, and it is worth nothing if the first two are wrong.
Run it in a bay
Profile is the hardest of the four specs to feel and the easiest to see on a launch monitor, because it shows up almost entirely in launch angle and spin rate rather than in comfort.
Take one head and two shafts of the same weight and flex with genuinely different tip sections. Hit ten alternating shots with each and read only two numbers: launch angle and spin. If they have not moved, the two profiles are not as different as the marketing said. If they have moved a degree and a few hundred rpm, that is the honest size of this lever — and now you know which end of it you want.
Related reading: The Clubhouse Guide to Golf Shafts · Shaft Flex Explained: Why the Letter on the Label Lies · Weight Before Flex: The Shaft Spec That Decides the Rest · Torque: What Makes a Shaft Stable, and What Makes One Loud

Sleeper Classics: Great Clubs the Market Forgot
The used-club market has a memory problem. Prices track two things — marketing budgets and recency — and neither has much to do with how a club actually performs. A driver that led forgiveness testing in its day gets lapped by nine model cycles and lands in the $100 bin next to genuine junk. A forged iron a Champions Tour pro carried in his own bag sells for less than a single new wedge because the brand never bought enough American ad pages. That inefficiency is your opening.